
AI development has been super crazy these day. Its use cases span everything from creating and analyzing documents, images, and videos, one-shotting complex apps, autonomous research assistants that can draft papers and design simulations, debugging code, discovering vital security vulnerabilities, and even orchestrating entire workflows across industries. AI is widely believed to disrupt job security, as automation and intelligent systems increasingly replace tasks once performed by humans.
But is that really true?
This simple question is actually what led me to do my own data analysis about AI role in today's economy. I use the Anthropic Economic Index raw data as my main source for the data pipeline because Claude by Anthropic currently is considered by most people as the most useful model in the professional market.
The Anthropic Economic Index raw data contains some metrics with multiple facets collected during user interaction with Claude AI. The analysis dimensions consist of geographic facets that break the data down by location, content facets describing the nature of each interaction, and numeric facets that capture continuous measurements around each interaction. There are five versions of the dataset, collected at different times, although the schemas include some breaking changes. I also incorporate some external data such as country population, country GDP, and O*NET data (comprehensive occupation dataset) to enrich the output dataset.
This post would be about a high level technical explanation of this project. If you are more interested in the gritty details, visit the project public repository on GitHub. You can also view the data reports in AI Economic Index.
The whole data pipeline workflow for this project is illustrated in the following figure.
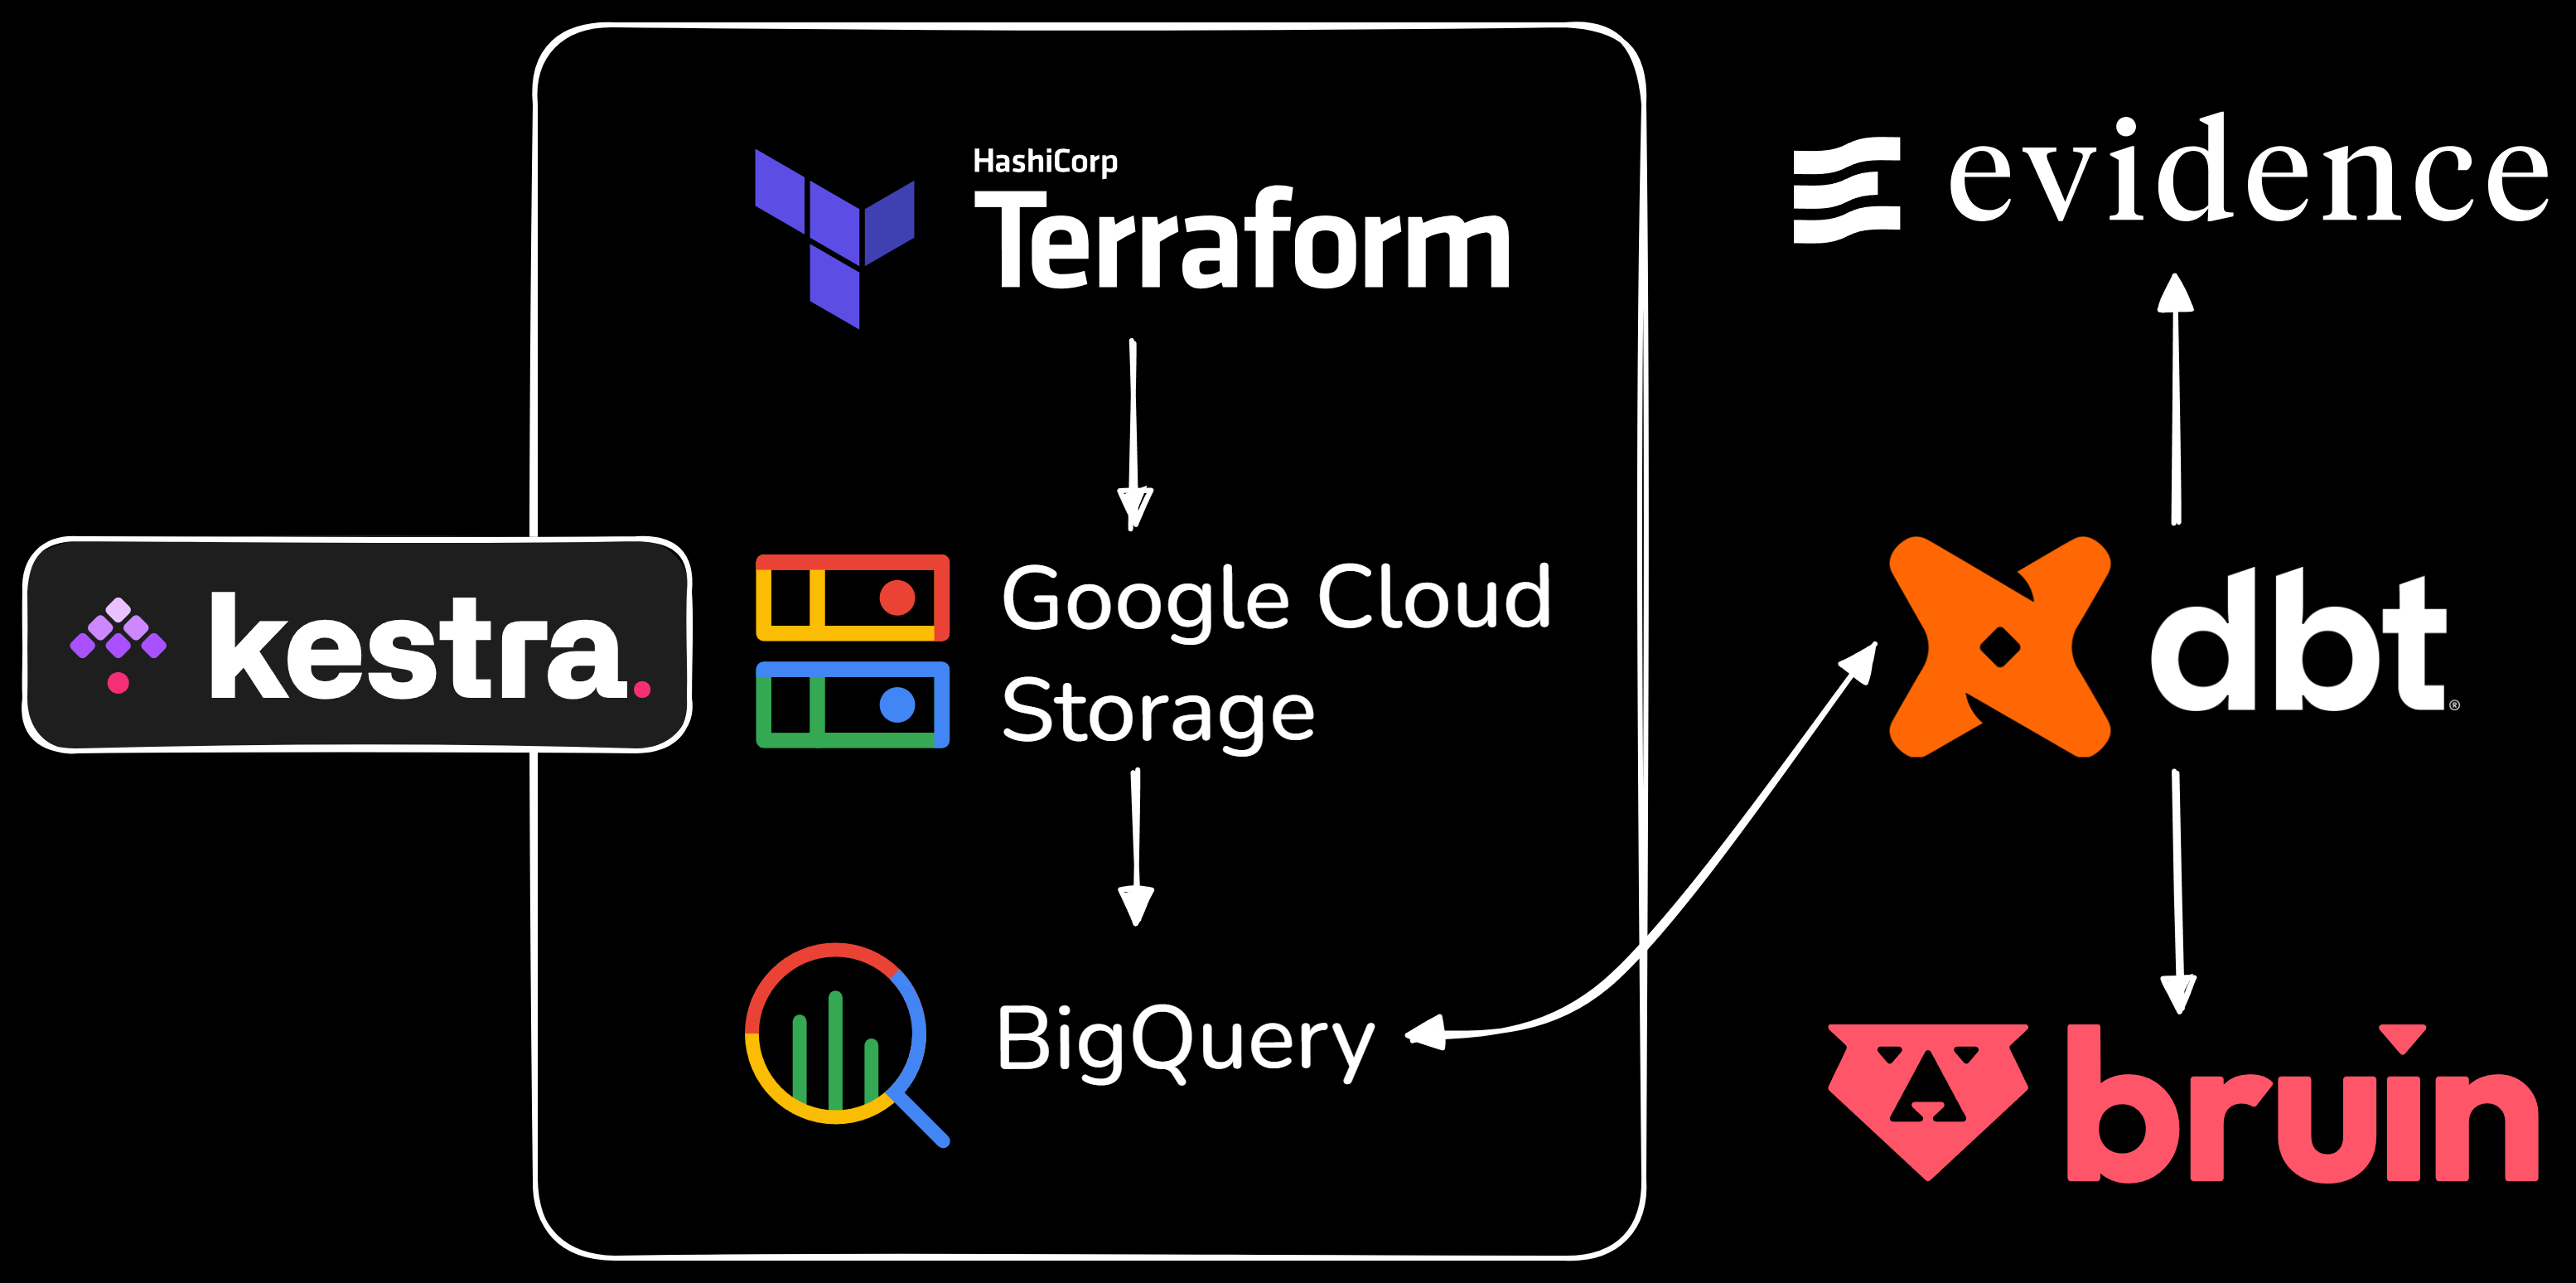
I use kestra as the workflow orchestration platform. The main difference from Apache Airflow is that it is more about declarative configuration which means we can use whatever language we want for the workflow process. I use docker to run kestra.
My data pipeline is ELT (Extract - Load - Transform) so that I can take more advantages of using data warehouse. In the orchestration, first, I created a workflow to save all important Google Cloud key-value pairs in kestra which will be used for the other workflows. Then, I created a workflow to set up the Google Cloud Storage infrastructure by using code with Terraform. Next, I created a workflow to extract the data from the Anthropic Economic Index raw data, to upload it into Google Cloud Storage as the data lake, and finally to load it into BigQuery as the data warehouse. Another workflow is created to cluster the data in the data warehouse based on geography, geo_id, facet, and variable columns. I also created a workflow to extract and load the external data.
The next phase, data transformation, is performed using dbt. The data models are created in three layers: staging, intermediate, and marts. Staging cleans and standardizes raw inputs, intermediate applies business logic and joins, and marts provide aggregated tables for reporting and analytics. I also built a testing layer to validate that all models meet data quality expectations before their outputs are consumed downstream. Every model and its columns were fully documented to make future development straightforward.
I use raw and external data in the data warehouse for staging layer. External data is put in the staging layer instead of seeds models because the I think the data has too many rows to be considered in seeds models and it also has to be cleaned and processed later.
In the intermediate layer, I normalized inputs, such as geography standardization, renaming task labels, removing not_classified buckets. I also enriched the data by joining external sources like working-age population and GDP metrics, ensuring that each geography had consistent contextual attributes. From these enriched scaffolds, I derived usage metrics, such as per capita usage and index values, which provide a standardized way to compare adoption across countries and states. Beyond usage, I computed percentage index metrics for collaboration and request facets, benchmarking them against global or U.S. baselines to highlight relative strengths and weaknesses. Task-level data was mapped to SOC (Standard Occupational Classification is a system used to categorize and group jobs into a consistent framework) major groups, adding occupational context to the analysis and enabling downstream aggregation by workforce categories. Finally, I calculated automation and augmentation percentages, derived from collaboration counts, to quantify exposure to AI-driven change. Automation captures patterns where Claude drives task completion, either by handling a task end-to-end with minimal input, or by running within a feedback loop where the user steps in only as needed. On the other hand, augmentation captures patterns where Claude plays a supporting role, such as helping users learn, iterating on work together, or validating outputs the user has already produced.
In the marts layer, I surfaced the enriched intermediate outputs into purpose-built reporting tables. The foundational mart brings together geography normalization, geo names, zero-fill scaffolding, and external demographic and economic metrics into a single long-format table, making it the canonical enriched source for downstream consumers. From there, I built a work-focused SOC outcomes reporting mart scoped to global work use cases, computing task success rates, AI autonomy scores, and time metrics comparing how long tasks take with and without AI help. Continuous time metrics use task-level medians rather than means to reduce sensitivity to outliers, and all confidence intervals are built from variance propagation using 1.96 times the standard error. Time savings are then expressed as a ratio of 1 - (human_with_ai_time / human_only_time), with conservative and optimistic bounds crossed from the propagated median CIs. For trend reporting, I built three longitudinal marts: one tracking occupational share by SOC group across all five report releases, one capturing task-level share changes from the first report through the last report with relative change percentages, new-task flags, and presentation-ready change labels, and one summarizing the automation-versus-augmentation split per report version to show how directive and feedback-loop patterns compare against validation, task-iteration, and learning patterns over time.
Once all the analytics engineering transformations were completed in dbt, I built a dashboard using Evidence by directly pulling the data from the marts models. Evidence connects to BigQuery, runs the SQL queries we define against those warehouse tables at build time, and then compiles the results into a static web dashboard. This means the dashboard is version-controlled, reproducible, and can be deployed anywhere, while still reflecting the latest warehouse data whenever the site is rebuilt. The dashboard can be viewed in AI Economic Index.
As a bonus, I also created an AI data analyst app in Discord using Bruin, allowing users in my AI Economic Index Discord server to discover more insights about my data reports simply by asking Bruin questions. What makes this interesting is that Bruin can query the data pipelines and return answers based on actual query results. To enable this, I first set up a Bruin pipeline that passes through key intermediate and marts dbt models, such as task-to-SOC mappings, enriched datasets, and reporting tables. Every Bruin asset and its table columns were also fully documented so that it will be easier for Bruin to parse the data and generate queries. Once the pipeline was in place, I connected Bruin as an app in Discord, so the Bruin dataset could be consumed directly for AI-driven data analysis by users. You can join the AI Economic Index Discord server here.
And that concludes my story of building the AI Economic Index pipelines, from raw data all the way to actionable economic insights. Next, I’ll be writing about the analysis reports, where I’ll share the findings and patterns that emerged from the data.
![]()